The AI explosion has a physical cost. Behind every prompt, traditional data centers consume billions of litres of water to fight heat. The real bottleneck isn't electricity, it's inefficiency. HyperNext is building infrastructure that respects both.
Every megawatt of AI compute we bring online is matched by an operational programme in water stewardship and renewable energy. Already running. Already measured. These are not offsets.
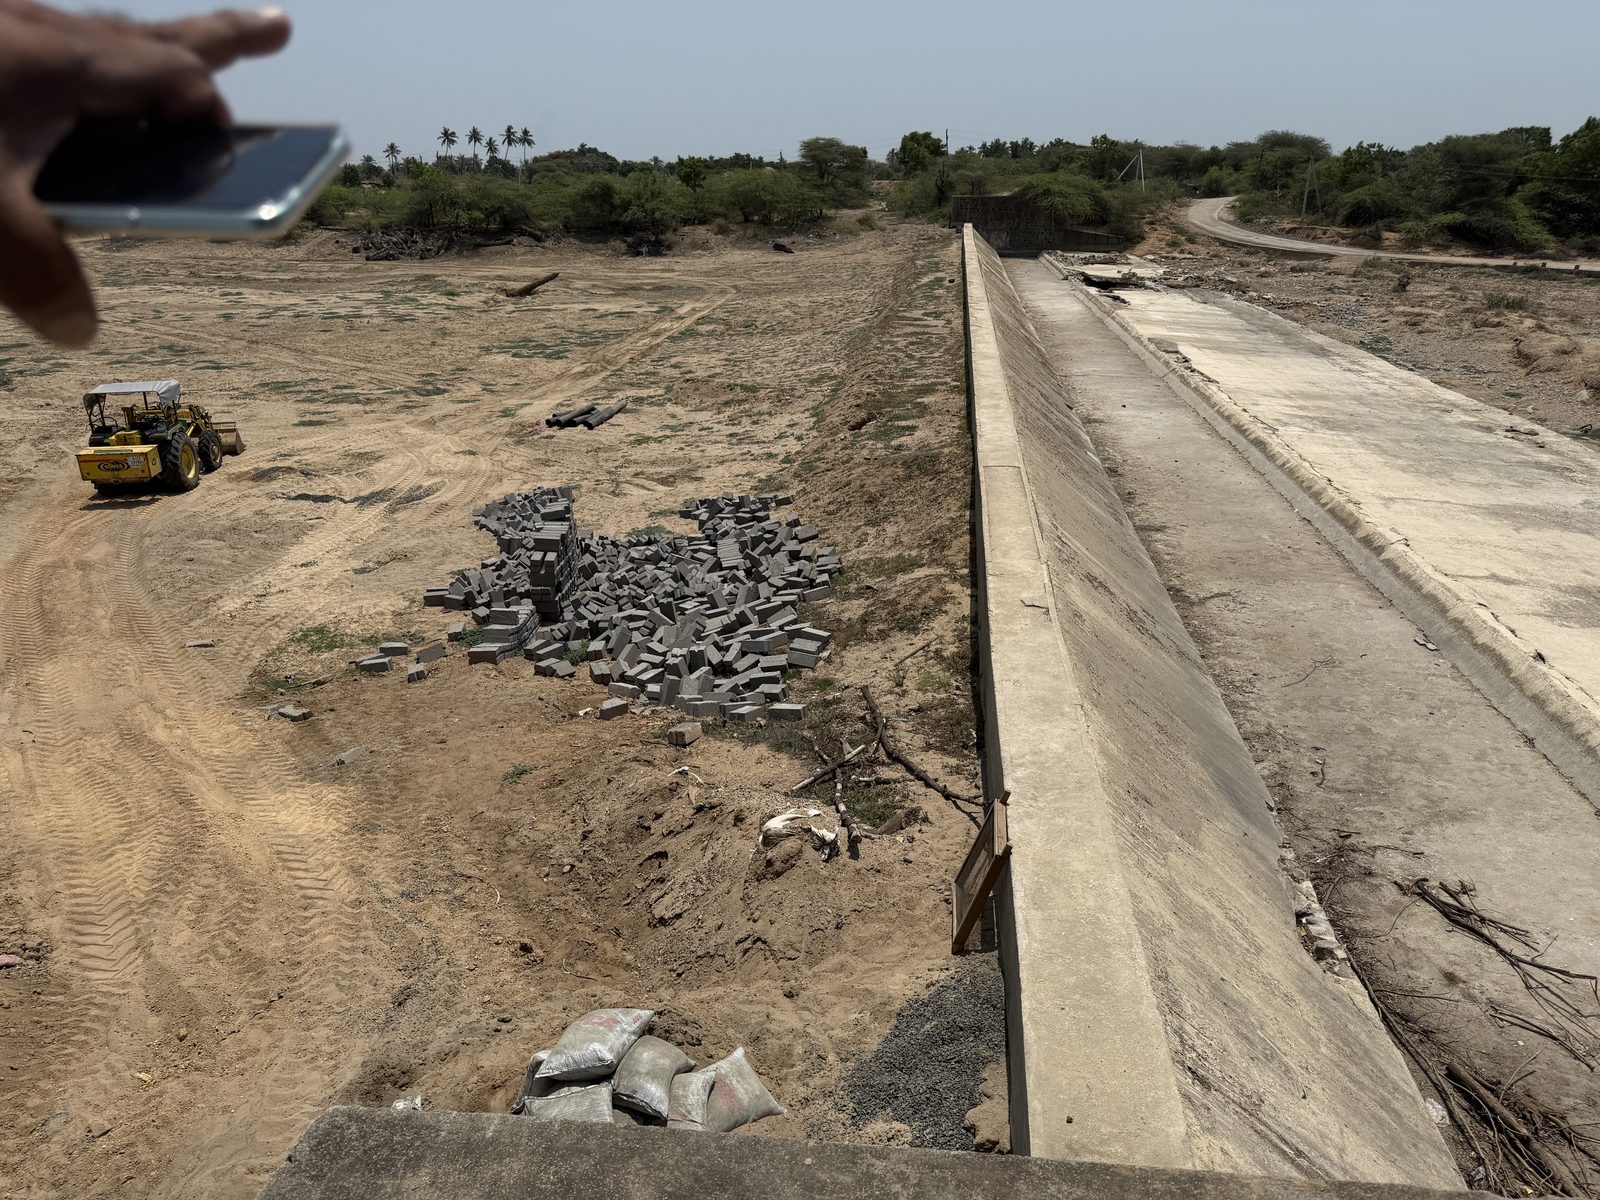
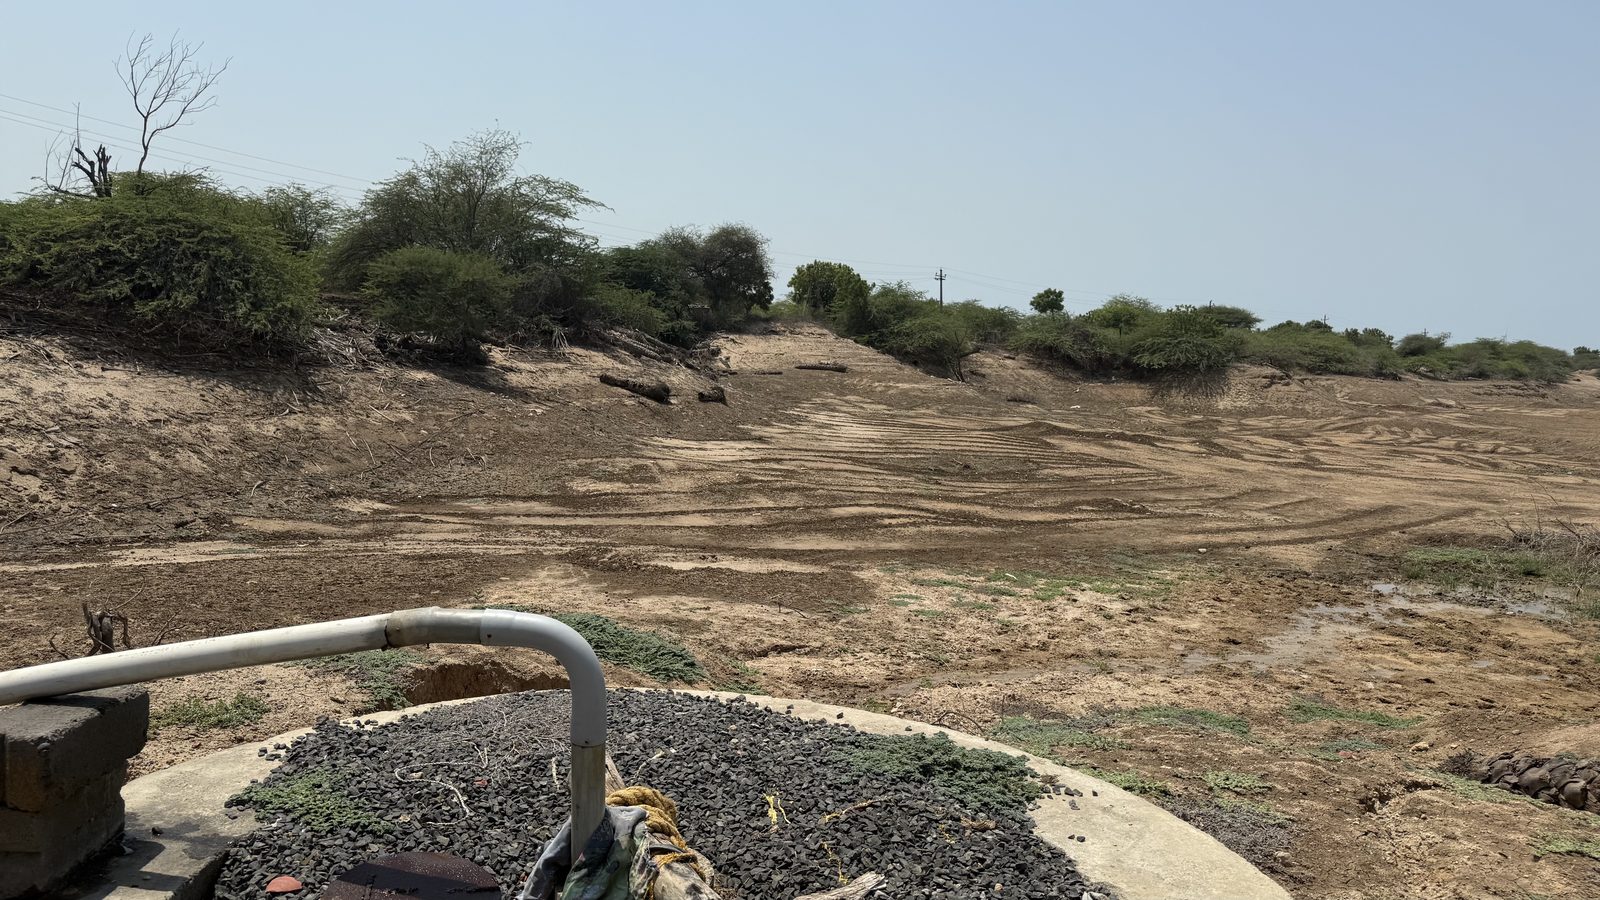
Our water-conservation programme on the Nagmati River has prevented more than five billion litres of freshwater from flowing unused to the sea, recharging aquifers and supporting downstream agriculture and communities. A direct, measurable response to the water cost of AI infrastructure.
Our captive solar generation plant in Khavda, Kutch is operational at 700 MW today, with more than 2 GW of additional renewable capacity already under planning, securing HyperNext's path to powering hyperscale AI growth with clean, sovereign energy.
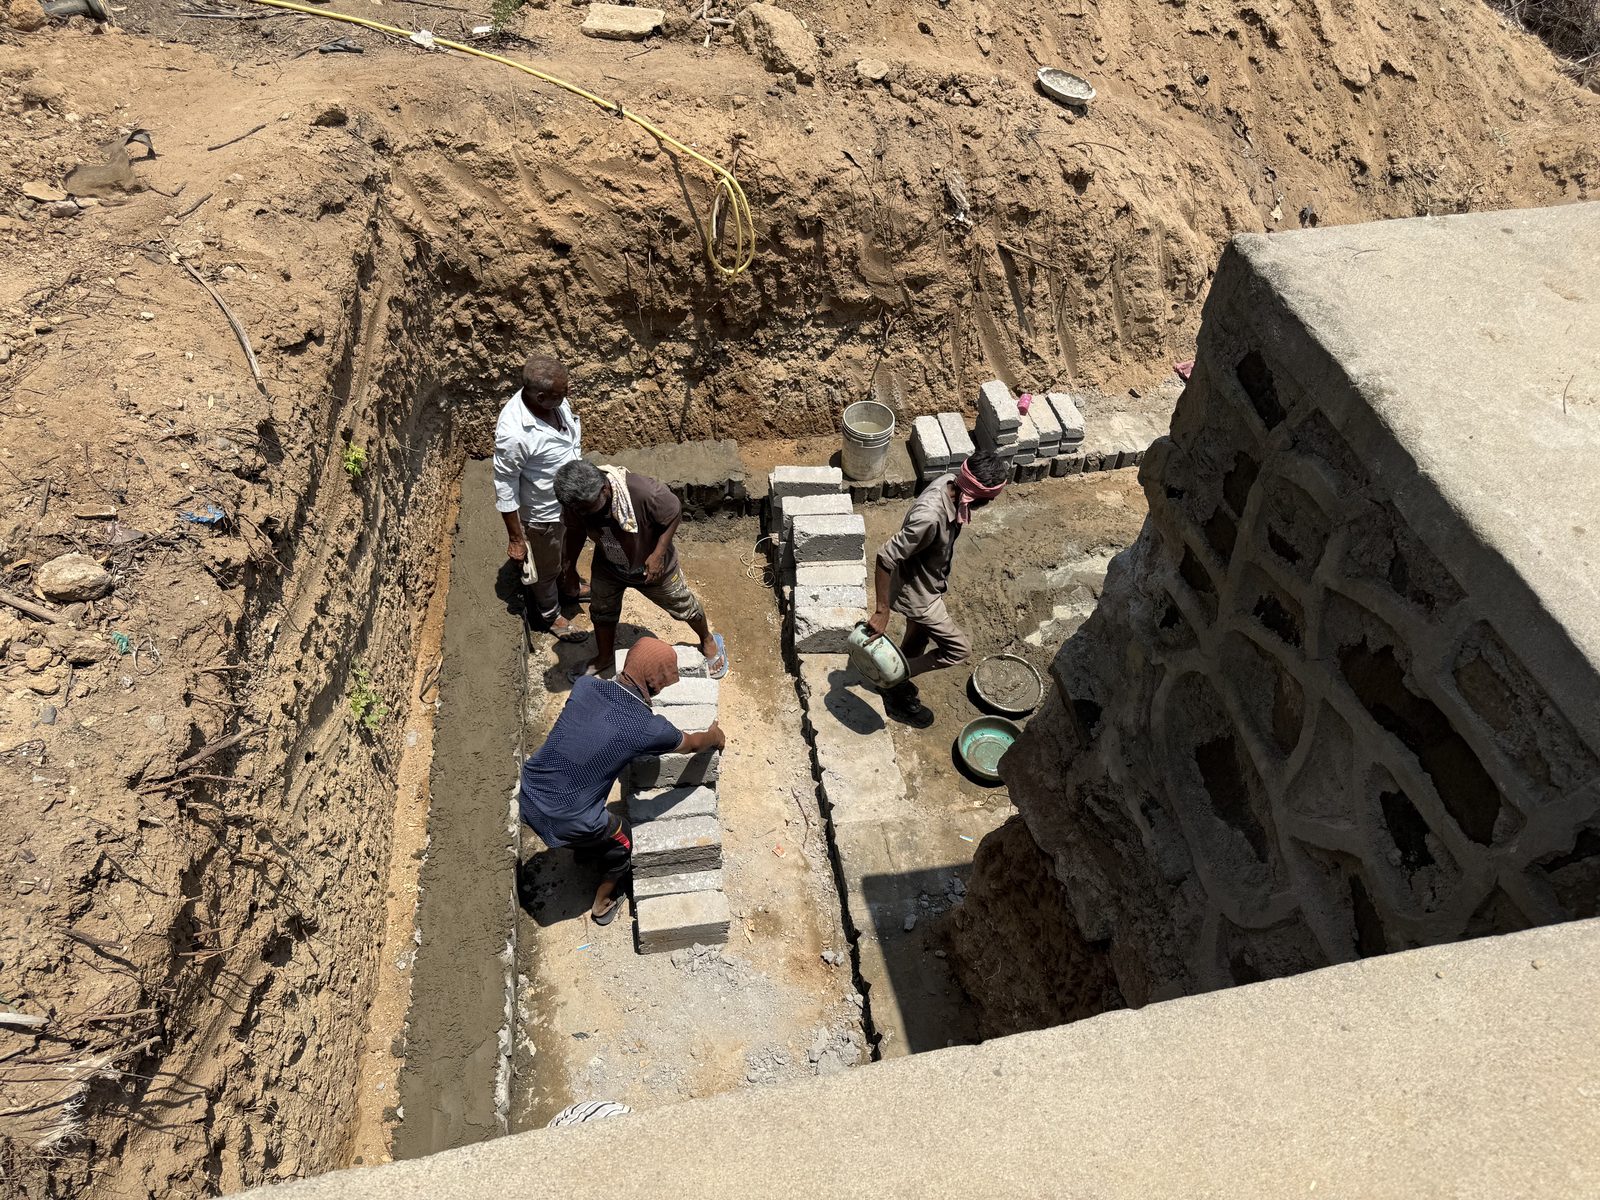
The Nagmati programme is built, not narrated. Recharge weirs, percolation wells and channel works across a seasonal river in Kutch, Gujarat, engineered to hold the monsoon long enough to refill the aquifer beneath it.
Our 700 MW captive solar plant at Khavda, Kutch is operational today. Solar only runs in daylight and at about a fifth of its rated output over the year, so it is paired with wind, storage and grid backup to cover the load day and night. Across every HyperNext campus in India, an in-house model works out how to buy power at the lowest cost while keeping it fully renewable and available in every hour. Captive solar, a 38% wind share and battery storage are sized to carry the load around the clock. The grid stays connected only as Tier IV backup, and we have started early talks on clean nuclear baseload for the hardest weather days. This level of round-the-clock renewable cover is still rare for a data center operator in India.
Captive solar and wind, co-located battery storage, bilateral PPAs and short-term buys from the power exchange. We cost and model every source together instead of picking them one at a time.
The model looks at all 8,760 hours in a year, not a yearly average. It finds the cheapest way to meet the load while staying renewable and reliable, and buys from the market when prices are low.
A renewable supply plan for each campus that meets the load every hour, keeps cost down and stays inside state and central rules. Reviewed and adopted, not left on a slide.
Solar overbuilds during the day and charges the batteries. Wind picks up overnight. Stored power covers the evening. The result is renewable power at every hour, not only in daylight. Grid power stays idle as Tier IV backup. The profile shown is illustrative of how the adopted plan dispatches.
Wind makes up 38% of the mix, well above the 25% mandated minimum, sitting alongside captive solar and battery storage so generation is never bunched into daylight hours. Grid standby and any future nuclear sit outside this mix, as clean and firm backup. These are shares of the energy delivered over a year. The split shown is indicative across the India portfolio.
We size the renewable build to the total facility load, not the IT load alone, and to the highest PUE we run across the year, so the campuses are never short in the hot months. The IT load across the three campuses is about 1.55 GW. At a peak PUE of 1.35, total load reaches about 2.1 GW. Solar and wind are then sized to carry that load around the clock, with battery storage moving daytime solar into the night.
Sizing to the summer peak rather than the yearly average leaves headroom on the hottest days. Battery storage is then sized in gigawatt-hours to carry the evening and overnight load. Figures are illustrative and based on the planned full-build load across the three campuses; actual capacity factors and PUE are set per site.
Solar dips through the monsoon and loses a little output to heat in peak summer, so its best months are the clear, milder weeks around March and October. Wind is strongest through the monsoon, so the two sources cover for each other across the year. Load is shown at 0.95 power factor, the apparent demand that the grid connection and generation are sized to, about 5% above the real-power load. Generation runs ahead of load from March to September and the surplus is banked for the shorter winter days. Across the full year, renewable generation stays ahead of total load. Profile illustrative.
The IT load holds steady through the year at about 1.55 GW. Cooling is the part that moves with the seasons. PUE runs near 1.15 in winter on free and dry cooling and up to about 1.35 in the hottest months, so the total system load peaks near 2.1 GW in summer. The renewable build is sized to that summer peak, not the yearly average, so the campuses are never short on the hottest days. The PUE curve is plotted on the right axis. Figures are indicative of the planned full-build portfolio across Hyderabad, Kakinada and Nava Raipur.
Across the India portfolio, the generation, partnership and market deals behind our 100% renewable target are signed and in place. The counterparties are commercially confidential, so we describe them by what they do rather than by name.
Our captive solar plant at Khavda, Kutch is running today at 700 MW and supplies clean power through the day, with more generation secured through a recent acquisition.
Our captive wind at Khavda, Kutch is running today at 35 MW, and a long-term wind partnership scales it toward the 38% wind share, above the 25% mandated minimum, strengthening overnight supply.
A firm power purchase agreement is signed and in place to cover low-renewable periods.
A confirmed agreement lets us buy power on the Indian Energy Exchange for low-cost green top-ups and balancing.
Captive solar, co-located batteries, wind, bilateral PPAs and short-term contracts, sized to keep peak-hour costs down while meeting RPO and RCO targets across solar, non-solar, hydro and storage.
We work out the General Network Access and T-GNA we actually need, so we do not pay for transmission we will not use. Deemed-GNA on existing captive assets avoids extra charges.
Co-located batteries move daytime solar into the evening and night. That flattens the load curve, cuts peak-hour charges and keeps reliance on coal-heavy grid power low.
Grid standby with the local DISCOM backs up 24/7 uptime at low redundancy cost, holding Tier IV level 99.995% availability with sensible reserve margins.
Most operators buy power on the cheapest headline tariff and add renewable certificates later. That hides cost in peak charges and leaves reliability and green cover to chance. Planning the whole system together gives a better result on cost, reliability and carbon at the same time.
Lower landed cost of power against a normal grid-tariff baseline, from a better mix, storage and the right regulatory waivers.
Tier IV level uptime, with grid standby sized by the model instead of over-built.
Every hour of the year is planned, so supply holds at night and on low-wind days, not just on a yearly average.
Ordinary procurement chases one number, the unit rate. Our model balances cost, hour-by-hour reliability and renewable cover at the same time, so a saving in one place does not create a problem in another.
The cheapest tariff often comes with the highest demand and peak charges. We plan for the lowest total of capital and running cost over the life of the assets, so the plan that wins is the one that is cheapest to run.
Transmission and wheeling waivers under state data center policies, cross-subsidy and additional surcharge relief on green power, and deemed-GNA to cut switching costs are all planned in from the start.
Solar, wind, storage and grid standby are planned and run as one portfolio and bought on the market when it is cheap. Bought separately, each part is weaker. Planned together, they cover for each other.
Solar, wind and storage carry the renewable load. For the hardest weather days we also want firm, carbon-free backup. HyperNext has started early talks with CORE Energy Systems, an Indian nuclear-sector engineering and EPC firm with about two decades of work for NPCIL, BARC and IGCAR, on ways to add dependable nuclear-backed baseload for the AI campuses. This is exploratory today. We see it as sensible cover for a future where round-the-clock clean power decides who can build at this scale.

Nine stages take us from understanding demand to delivered power. Planning, optimisation and contracting are complete across every campus in India. The solar asset is acquired, the wind partnership and backup PPA are in place, and Indian Energy Exchange access is secured. Regulatory approvals and the operational ramp-up are now underway.
We map energy needs, 24x7 load curves and a phased build.
Baseline unit costs checked against market and DISCOM tariffs.
We assess captive, PPA, wind, storage and market choices.
Supplier responses reviewed on competitive, benchmarked terms.
The model sizes contracts, timing, the 38% wind share and storage for least cost.
The optimised, phased plan locked across every campus in India.
Solar asset acquired, wind partnership and backup PPA in place, IEX access secured.
Open access, GNA and T-GNA, waiver and exemption filings.
We implement and dispatch against the plan.
We are not just building faster. We are building drier. Every architectural choice. 800VDC power, direct liquid cooling, dry-cooling air, water reuse, was selected to minimise the water and carbon weight of every workload our customers run.
Every piece of equipment is liquid cooled, from the GPUs and servers down to the storage, firewalls and switches. The data hall rejects its heat through dry coolers alone, so evaporative water consumption per kW of IT load is effectively zero.
Captive solar at gigawatt scale, located in India. Our path to net-zero is not built on third-party RECs, it is built on grid-connected generation we own and operate.
800VDC eliminates 5+ AC conversion stages. Direct liquid cooling collapses the chiller plant. Every watt of avoided loss is a watt of avoided water and carbon.
It is operational. Talk to us about how we can match the sustainability profile your board, your customers, or your regulators expect.
The AI industry has a water problem. Roughly 560 billion litres a year today, on a trajectory to cross 1.2 trillion by 2030. Most of it evaporated through cooling towers, in regions that cannot afford to lose it. HyperNext was built on a different premise. Drier, not just faster.
Our cooling architecture is closed-loop direct-to-chip liquid cooling for every piece of equipment in the hall, from GPUs and servers to storage, firewalls and switches. Heat is rejected by dry coolers alone. We run no evaporative cooling towers, so the cooling system draws no freshwater for heat rejection.
Every campus location is screened against current and projected water stress indices for the local basin. We do not site facilities where our cooling load would displace community or agricultural water rights, irrespective of how favourable other variables are.
Our Nagmati River restoration programme has saved 5+ billion litres of freshwater. We measure ourselves against returning more water to local watersheds than our facilities consume. Water-positive operations, not water-neutral.
Water Usage Effectiveness published quarterly per campus, with methodology aligned to ISO/IEC 30134-9. No averaging, no carve-outs. If we cannot measure it, we cannot improve it. And our customers report on us, too.
Kakinada targets LEED Platinum. The broader portfolio, LEED Gold. IGBC Green Data Center on every Indian campus. These are not marketing badges. They translate, line by line, into the scope-2 and scope-3 carbon accounting.
Workloads running on HyperNext infrastructure inherit our renewable energy attestation. 700 MW of operational captive solar at Khavda, with 2 GW more under planning, means your AI inferencing run on grid electricity that was not generated by coal. Your scope-2 emissions, lower by default.
Quarterly sustainability reports include LEED, IGBC, ISO 14001 and ISO 50001 documentation suitable for inclusion in CDP, GRI, BRSR and TCFD-aligned disclosures. We give you the evidence, not just the metric.
For our enterprise customers, the infrastructure footprint sits inside their scope-3 reporting. Choosing a LEED Platinum facility instead of a conventional Tier III peer can reduce your reported scope-3 data-center carbon by 35 to 60 percent, depending on workload profile.
Our customers in BFSI, healthcare and manufacturing report under RBI, SEBI BRSR, and global sustainability frameworks. HyperNext provides pre-formatted disclosure packs aligned to each. No data gathering project. The numbers are ready when your audit is.
The industry default has been air for low density, liquid for high. We use direct-to-chip liquid cooling across the entire spectrum, from the legacy 5 to 15 kW racks to the network layer itself, the firewalls and switches. The reason is sustainability, not just performance. Liquid moves heat with a fraction of the water and energy that evaporative cooling needs, and the data hall rejects that heat through dry coolers, not towers. For the highest-TDP chips we go further, with an in-house hybrid direct-to-chip cooling system that uses up to 37% less cooling power.
Every data hall is mirrored by a live digital twin. Thermal, airflow, power, humidity. Streaming from thousands of sensors into a 3D facility model. Operators see hotspots forming before they trip an SLA. Customers see their own footprint in the same model.
Computational fluid dynamics models updated against live sensor data. Hotspot prediction, cold-aisle containment validation, and rack relocation impact, all simulated before any move-add-change.
Every PDU, branch, rack and inlet measured to the kilowatt-hour. Stranded capacity visualised, redundancy validated, and provisioning decisions made on observation, not on nameplate ratings.
Each customer sees only their own footprint in the twin. Power draw, temperature inlet, redundancy state and capacity headroom, in a tenant-segregated view.
Machine-learning models trained on years of facility telemetry from our partner fleet predict component degradation. Pre-emptive maintenance windows replace reactive incident response.
Every server, every switch, every transformer, every chiller, carries a unique identifier from the day it leaves the manufacturer. Component-level tracking. RFID inventory. A chain of custody we document, from procurement through to certified recycling at end of life.
Components tagged at the OEM factory, scanned into our DCIM at receipt, and tracked through staging, installation, commissioning. Every asset has a documented provenance.
RFID-enabled rack scans during quarterly audits. Configuration drift, undocumented changes and physical asset movement all flagged automatically. No more spreadsheet-based asset registers.
The HyperNext HN-1 campus in Hyderabad runs its own on-site e-waste recycling and material recovery unit, authorised by the Pollution Control Board under the E-Waste Management Rules 2022. Decommissioned equipment is processed inside the facility perimeter. Other than spent lithium cells, which go to authorised off-site recyclers, every material stream is recovered on site, and data-bearing devices are destroyed under certified custody.
Storage media is sanitised under NIST 800-88 Purge guidelines, then physically shredded on site, before any material leaves the facility. Customers receive a Certificate of Data Destruction with serial numbers, witnessed sign-off, and chain-of-custody documentation. Data never leaves the building unrecovered.
Hardware does not leave a HyperNext campus as mixed waste. Every decommissioned unit is logged out of the asset register, drained of data, and broken down into clean material streams at our own on-site recycling unit at Hyderabad, authorised by the Pollution Control Board. Other than spent lithium cells, which go to authorised off-site recyclers, every stream is recovered on site. The aim is simple: nothing to landfill, and a documented trail for every kilogram.
Units are dismantled into clean streams at the on-site Hyderabad unit (HN-1): boards, metals, plastics, cabling, optics and cells are separated before anything is moved, so mixed e-waste never forms.
Capacitors and other hazardous components are removed first and handled within the on-site unit, keeping them out of the general recovery stream. Spent lithium cells are the one stream sent off site, to authorised recyclers under manifest.
Healthy units are tested and given a second life in non-critical roles such as lab, staging and internal workloads before any decision to recycle. Reuse always takes priority over recovery.
Copper, aluminium and steel are recovered at the on-site unit, and a dedicated precious-metals recovery line separates gold and palladium from circuit boards on site, returning material to the supply chain rather than mining it again.
Storage cells are screened for second-life use. Spent lithium cells are the single stream processed off site, sent to authorised recyclers for lithium, cobalt and nickel recovery. No cell is discarded as general waste.
The on-site unit operates under Pollution Control Board authorisation, and the off-site lithium recyclers are CPCB-authorised. Each consignment carries a manifest, weighbridge record and recycling certificate, so the chain of custody is auditable end to end.
We publish what we measure. Quarterly. Per site. With the methodology. No averages doing the work of statistics. No carve-outs doing the work of marketing.
Design PUE 1.25 in moderate conditions. 1.35 at 42°C peak ambient. Validated per facility, published quarterly. Aligned to ISO/IEC 30134-2.
Cooling consumes no water: sealed glycol loops and dry coolers, with no evaporation. The only site water is building services, recycled through our STP, which keeps site WUE well below 0.1 L/kWh against an industry average of 1.0 to 1.8. Aligned to ISO/IEC 30134-9.
Driven by captive renewable energy. Carbon Usage Effectiveness target below 0.15 kgCO2e per kWh of IT load, sliding toward zero as the portfolio approaches 2030.
Renewable Energy Factor above 85% across the operational portfolio by 2028. Captive renewable supply via our 700 MW Khavda solar and partnership wind allocations.
Reject heat made available to co-located industrial offtake. Districts, greenhouses, desalination. Customer-customer matching against our circular-economy partner network.
Construction and operational waste diverted from landfill. Tracked across packaging, e-waste, food, and decommissioned equipment. Reported quarterly.
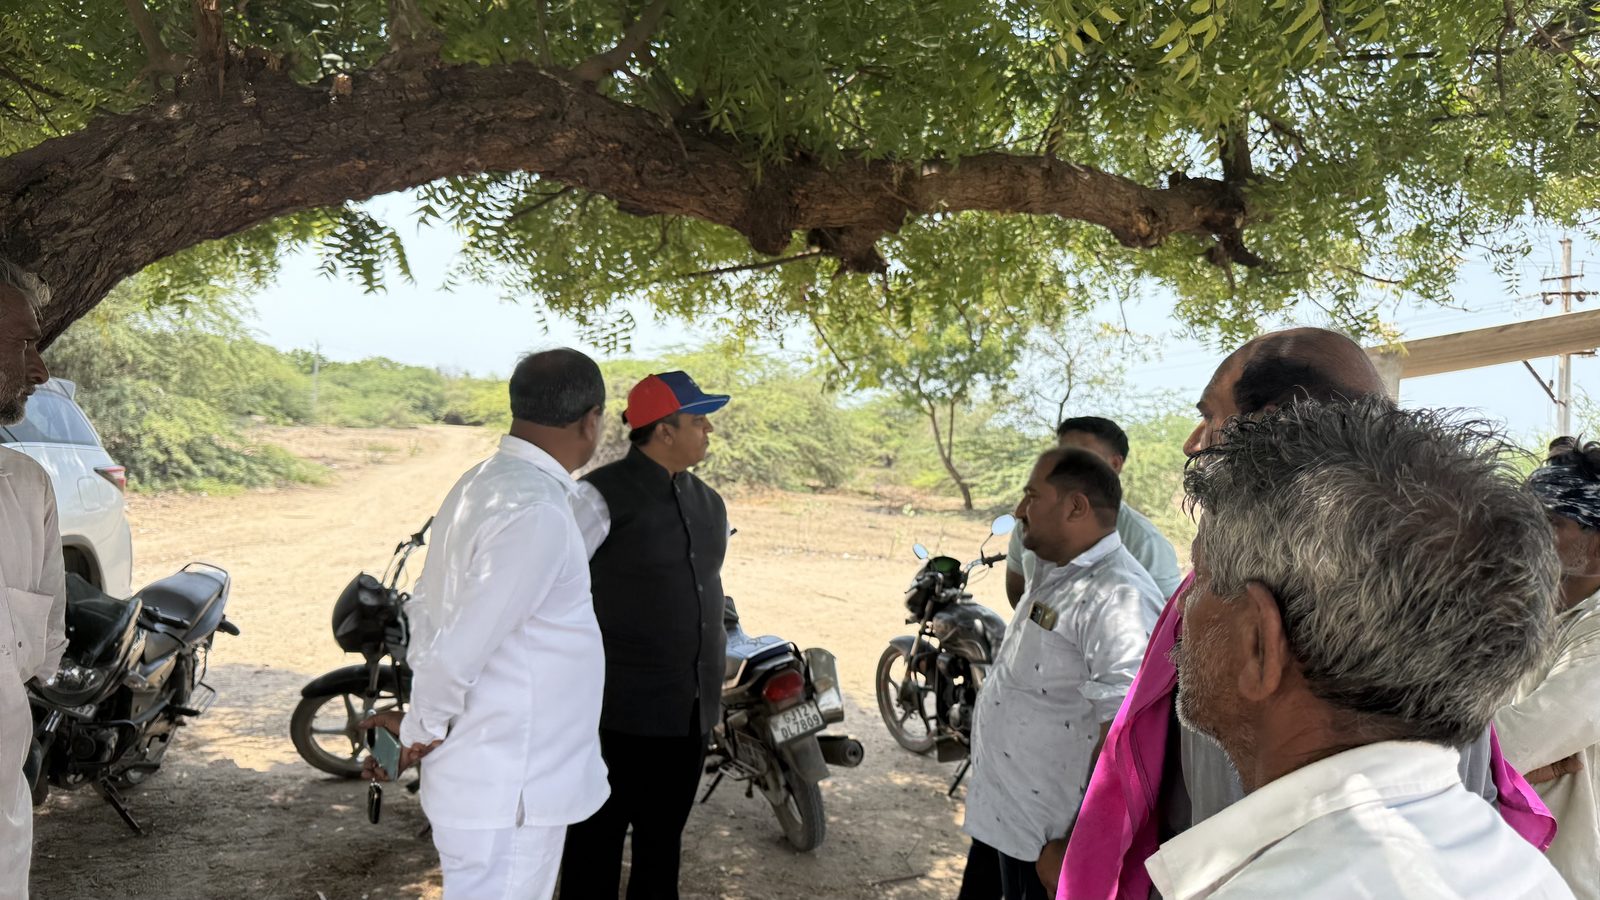
A data center is a thing that lives in a place. The place is more than the perimeter. We think about that. The watershed. The species that were there before us. The schools across the road.
Every campus site dedicates a minimum of 30% of land area to native-species restoration. Indigenous flora prioritised, designed in consultation with local botanical and conservation experts. Not landscape gardening. Ecological restoration.
The Nagmati programme has restored more than 5 billion litres of freshwater to a stressed Gujarat watershed. Independent verification through third-party hydrology audits. Continuing programme expansion to other watersheds across our footprint.
Construction and operations procurement prioritises local supply. Target: 60% of operational spend within a 100-km radius of each facility. Measured and published per campus, per quarter.
Every campus operates a STEM outreach programme for nearby schools, a vocational training partnership with local ITIs, and a continuing-employment commitment to local hiring. Infrastructure that gives back.